
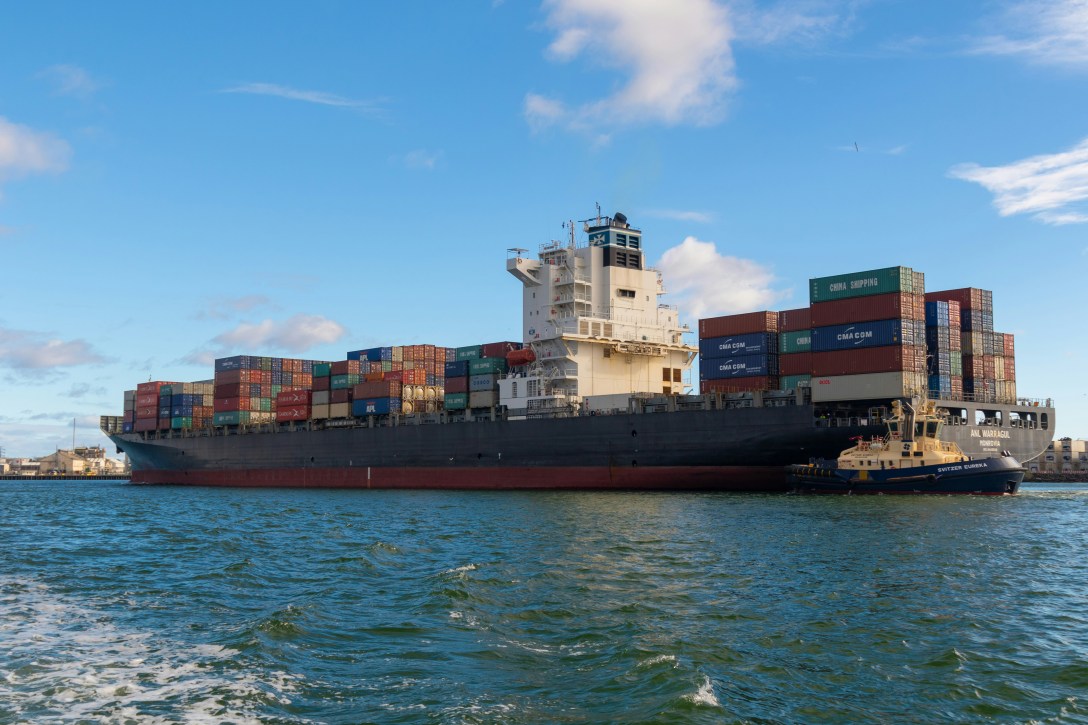
Barcelona, February 13, 2024.- Supply chain, logistics and transportation planners value maritime cargo statistics as an indicator to follow closely:
As supply chain managers seek to understand demand trends, port volumes are a helpful indicator.
Maritime gateways handled 40% of international freight value in 2022, according to the Department of Transportation. As a result, keeping track of seaport volumes can be a good barometer for establishing years- and months-long trade trends nationwide.
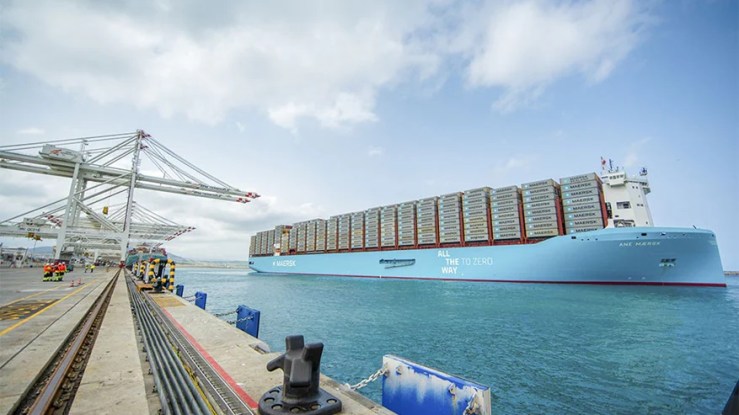
Take the coronavirus pandemic as an example: From 2018 to 2020, the top 12 U.S. seaports were handling roughly 46 million twenty-foot equivalent units of cargo, known as TEUs. Then, during 2021 and 2022, volumes skyrocketed to more than 53 million TEUs, leading to an infamous bout of congestion and logistics delays.
So far in 2023, volumes have normalized to pre-pandemic levels — but how far above or below 2019 will containerized trade end up?
Tracking monthly data can help shed light on that question. Use this tracker to see total volumes for the top twelve ports in the chart below, as they are released. Scroll down further and apply the filters on the left to sort volume data and historical insights by port, coast or month.
Information published in:

Foto de John Simmons en Unsplash
- Tech as a Sustainability Enabler

- What´s the difference between 3PL, 4PL and 5PL?

- How to scale supply chain sustainability programs affordably?

- “The use of blockchain in transportation companies is increasingly relevant, especially in the areas of traceability, security, and supply chain transparency”

- Maersk and Hapag-Lloyd announce two ocean network options with equal industry-leading schedule reliability
- Strategies for attracting and retaining drivers
- C.H. Robinson uses AI to report rates to an average of 11,000 daily emails to customers and carriers

- Meet us in #SITL2024, AndSoft stand K132, in Paris Villepinte

- Maritime cargo, macroeconomic indicator for supply chain planners

- Accenture survey finds 85% of companies plan to manufacture and sell most of their products in the same region in 2026

- Visit the new AndSoft stand, 7E20, at the Logistics Madrid Fair, on November 29 and 30 (Hall 7, IFEMA)
- Amazon has announced that it is launching Prime Air drone deliveries in the UK, Italy, and a third location in the USA, by late 2024

- Keys to fitting sustainability into supply chain planning

- “The journey from New York to Los Angeles typically takes a human truck driver five days to complete. Autonomous trucks can do it in 48 hours”

- Forbes Magazine: “Recommendations to cut costs in any supply chain, today”

- Continuous efficiency: Ecommerce and Last Mile

- Logistical consequences of the financial collapse of the third largest US carrier
- USA: “Truck Tonnage Dips 3% Year-Over-Year in July”
- Future of Manufacturing: Generative AI
- Industrial Distribution: “Just 10% or fewer of digital transformation efforts are successful”

- “We all want data-driven decision-making, it’s not gut feeling that we’re doing here anymore”

- Disruptive innovations for mobility thanks to the latest technology

- TuSimple completes first “Driver Out”, fully autonomous semi-truck on public roads in China
- TMS AndSoft News on Mobility
